I created my own debugger for Windows x64! [EN]
Last time I had a lot of time to work on my projects due to global lockdown. In order to not waste that time I decided to write debugger. Its main purpose was to teach myself more about low level stuff going on with debuggers rather than to use it daily. I think it is good base of code when I gonna need write tool for specific kind of malware. Maybe one time I will improve this project e.g add .pdb symbols support or make it scriptable (info about it in new posts 😁). Source is good start point for someone interested to debuggers. Project is available on my GitHub. Let’s introduce you to my debugger, more visually than last posts.
Quick presentation
Debugger at this time is able to debug 64 bit programs for Windows. Let’s load one.
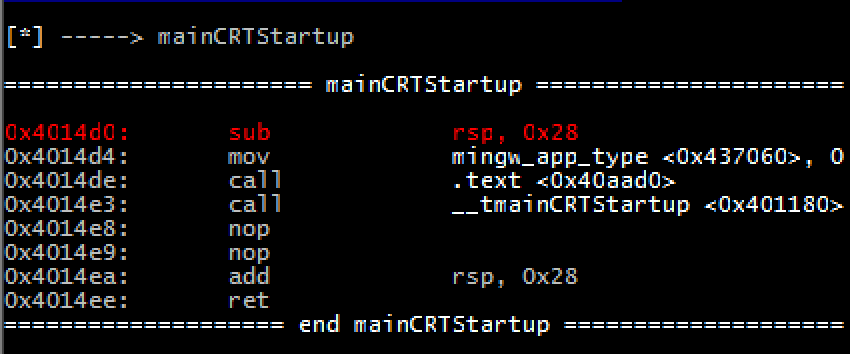
As you can see at the beggining it reads COFF symbols (e.g produced by MinGW), parse them and show, when there is match for particular address like shown below.
Every debugger needs breakpoints and stepping, here you go. (next instruction, step in, breakpoint)
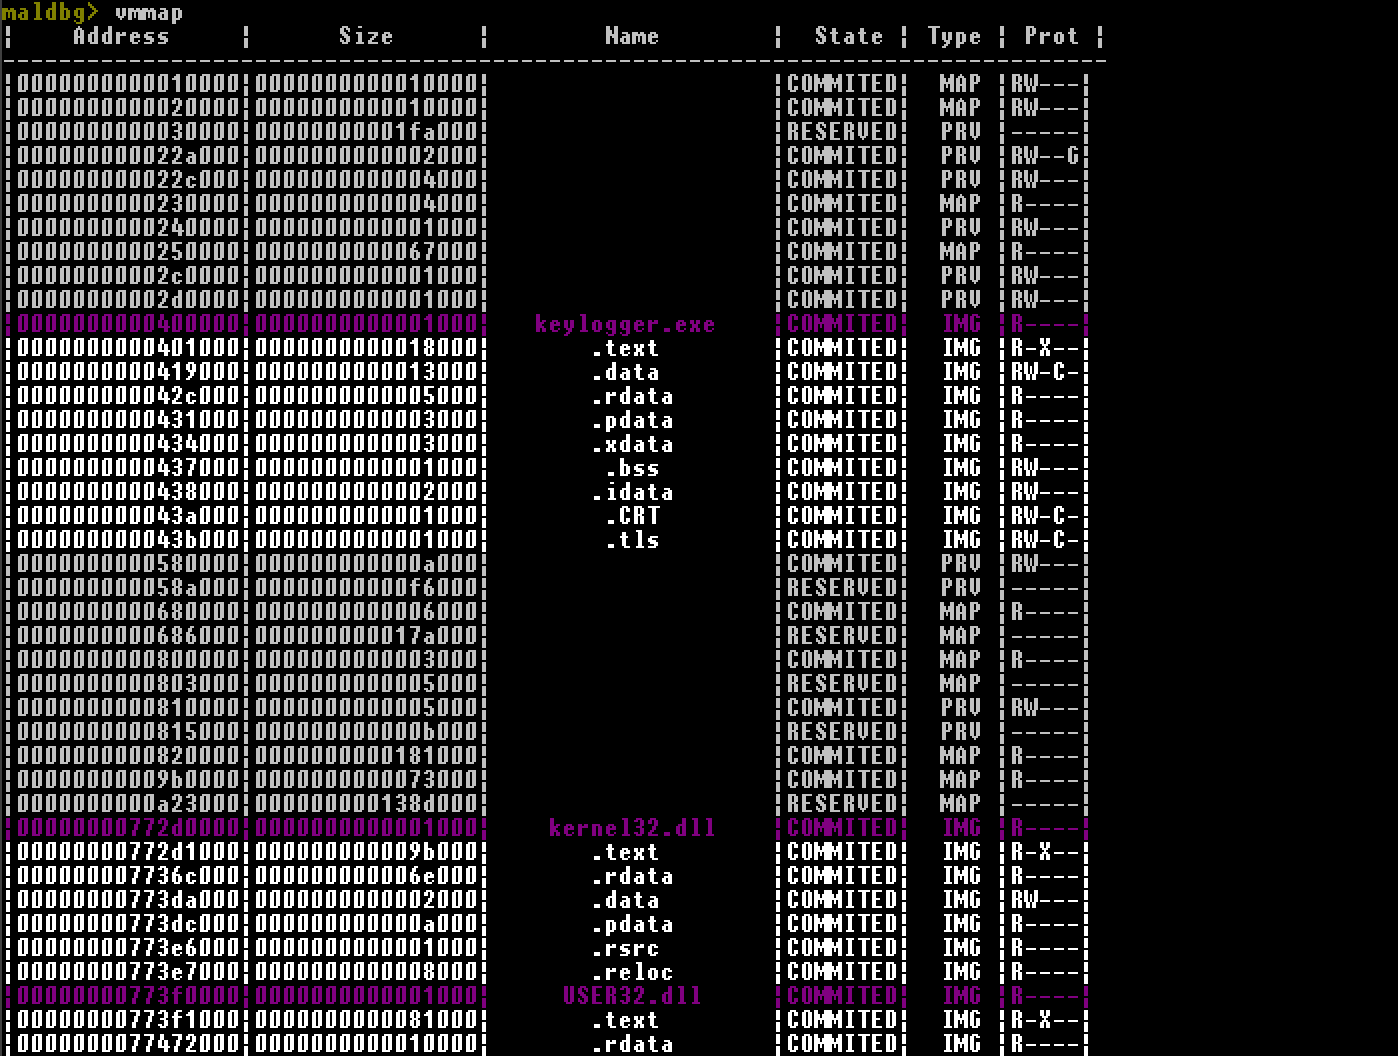
Want to see loaded modules with their sections ? Let’s check them by vmmap command. All modules loaded into address space are retrieved by VirtualQuery and then parsed.
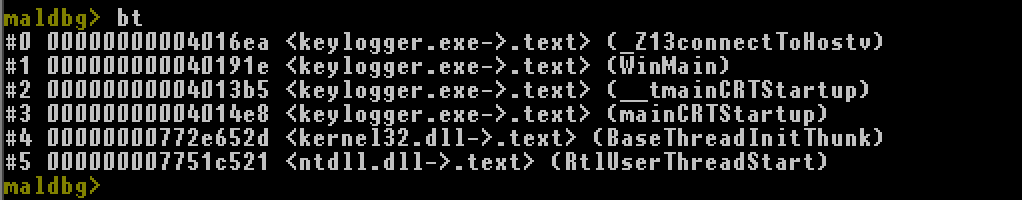
Let’s say debugee is stucked at some unhandled exception, we want to show backtrace.
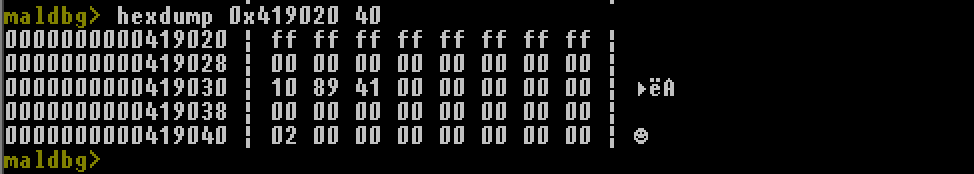
Read some memory at given address.
And a few more, check it out.
Dominik Tamiołło