Anti debug and anti RE with examples [EN]
Last time I spent a lot of time to familiarize myself with techniques that are used to prevent reverse engineer a program and I want share with you my knowledge. These protections are not used only by malware developers but also by companies that sell their products for high price and want them to be secure (mostly in terms of licence or activation checking). Anti cheats like VAC or PunkBuster also strongly depend upon such techniques. In this post I will cover anti reverse engineering techniques that applies to any operating system that is capable of running on x86 architecture. Anti debug protections on the other hand are valid just for Microsoft Windows (all the code was tested on 64 bit Windows 7 build 7601 virtualized by VirtualBox and Windows 10 x64 build 17763). All examples that I’m going to present here are available on my GitHub with nice script compiling it all at once.
Anti Debug
Anti RE
You just need nasm and golink that are standalone executables. nasm , golink
Anti Reverse Engineering techniques for x86
Quick introduction
If you don’t know what disassembly is then watch my video on YouTube explaining this
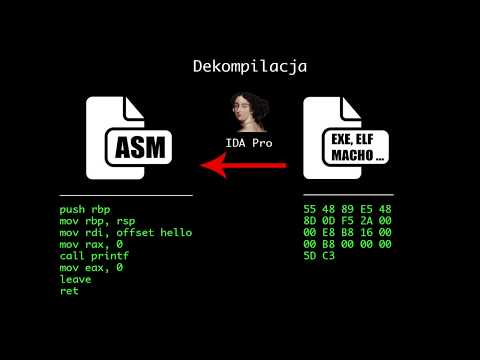
Tutorial is in Polish. Generally speaking, code that you write (assume C/C++ for simplicity) is processed on multiple stages. First stage of complete compilation is processing high level code to assembly code. Second stage is to take this assembly code and convert its source to raw bytes. If we have these bytes, we are able to reverse this process (not 100 % accurately). In this section I’m going to show some examples of how to mislead disassemblers. These techniques are based on fact that modern disassemblers are flow oriented. What is flow oriented disassembler? It is such disassembler that looks for conditional jumps over the code and analyse two paths that are possible to reach. There are some tricks that can mix up disassemlbers which I’m going to describe. All examples will be in assembly in intel syntax and disassembly checked in IDA PRO 7.0. x86 instruction set may be useful, available here.
je and jne instructions together
Take a look at this code
je l1 + 1 ; means one byte after l1 label
jne l1 + 1

l1:
db 0xe8 ; just one byte which starts instruction CALL rel32, refer to x86 instruction set
xor eax, eax ; l1 + 1
ret
times 2 db 0x90

xor eax,eax
je l2 + 1

l2:
db 0xe9 ; starts instruction JMP rel32
pop eax ; l2 + 1
ret
Code starts with mysterious two conditional jump instructions appear. If we locate instruction jump if equal and jump if not equal one below another we end up with unconditional jump. But what flow oriented diassembler does in such scenario ? It tries to locate true and flase branches. For first je it jumps to l1+1 or go to instruction jne l1+1. And what are branches for jne l1+1 ? These are l1 and l1+1. Disassembler can’t provide us disassembly view with all these 4 paths.
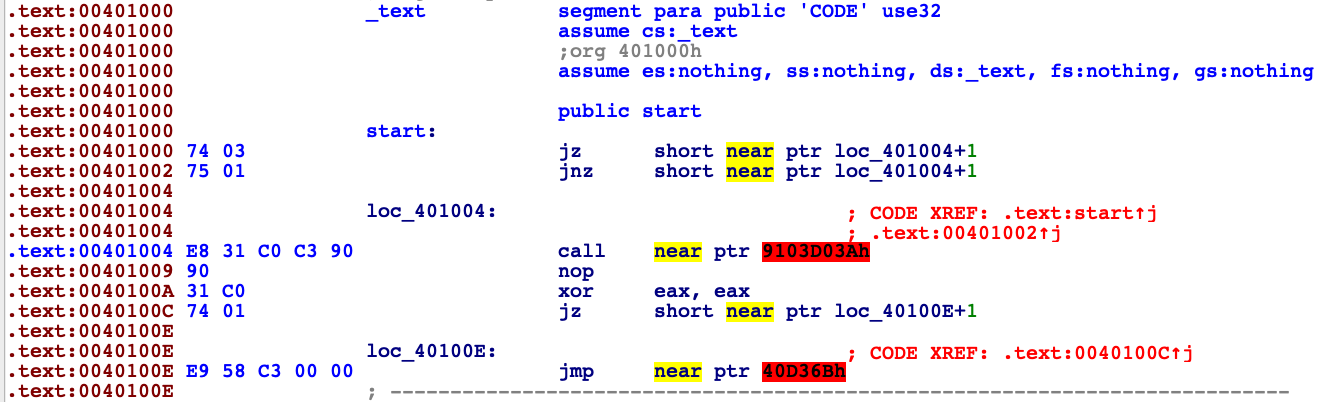
Compiler decided to show us scenario when instruction jne l1 + 1 is not true and just go to the next instruction (l1 label). We know that this branch is never going to be taken, but unfortumately IDA doesn’t know that. The real path of execution is as shown below.
jmp l + 1
xor eax, eax ; l1 + 1
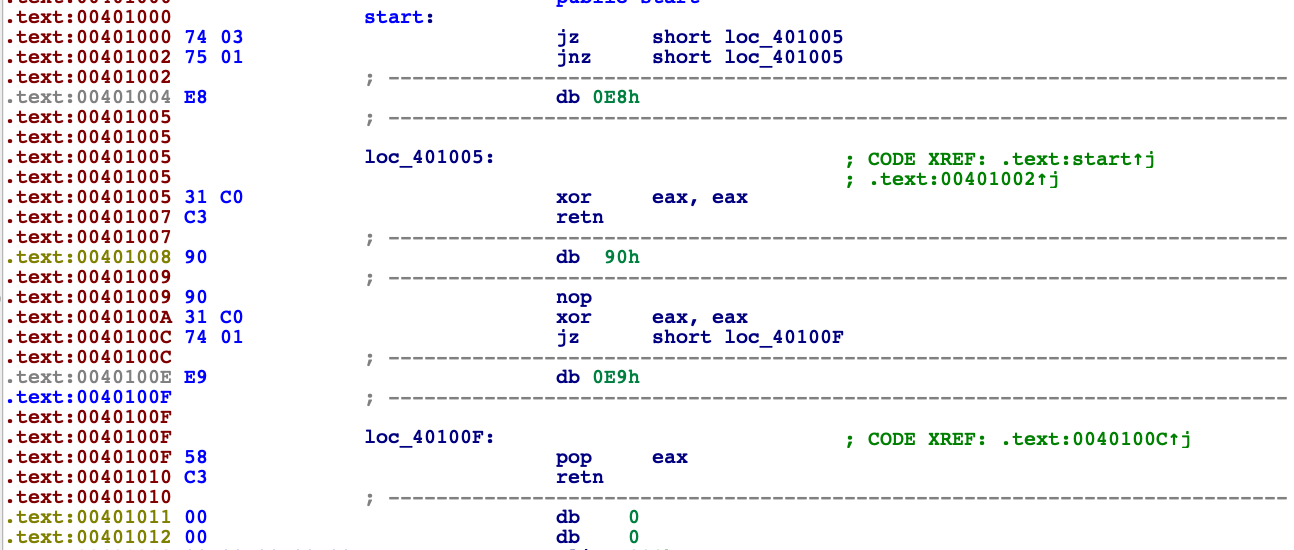
retWe can change disassemled code in IDA by using D key to change bytes to data and C to disassemble them from other start point. After this action our disassembled code looks like this.
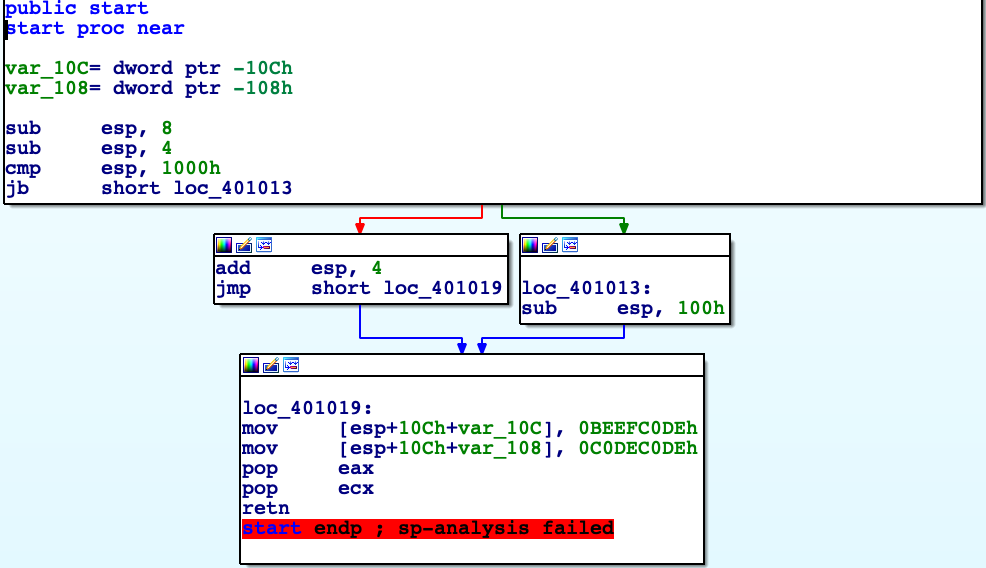
stack variables mixed up
sub esp, 8 ; two local variables on stack
sub esp, 4
cmp esp, 0x1000
jb l1 ; esp never will be below 0x1000 address
add esp, 4
jmp l2
l1:
sub esp, 0x100 ; 64 local variables more
l2:
mov dword [esp], 0xbeefc0de
mov dword [esp+4], 0xc0dec0de
pop eax
pop ecx
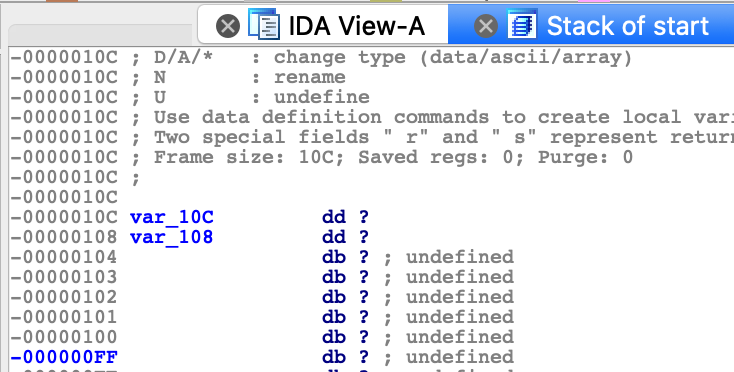
retLike in example before the problem here is wrong decision what branch should be taken. Stack address is never going to be below 0x1000, that’s just how OS’es arrange virtual memory. Now IDA thinks that there are 66 local variables and disassemble is mess.
And check stack by CTRL+K
call function by exception
push exception_handler
push dword [fs:0]
mov [fs:0], esp
; 3 lines above set up new exception handler in SEH
xor eax, eax ; eax = 0
div eax ; dividing by 0, raise exception manually
normal_execution: ; code which will never be executed
pop dword [fs:0]
add esp, 4 ; remove exception handler from SEH frames linked list
push 0x40
push paramTitle
push paramText
push 0
call _MessageBoxA@16
ret
exception_handler:
mov ecx, [esp + 0x0c] ; CONTEXT struct
lea edx, [ecx + 0xb8] ; CONTEXT->EIP
mov dword [edx], redirected_execution ; save redirected function to CONTEXT->EIP
ret ;
redirected_execution:
pop dword [fs:0]
add esp, 4 ; remove exception handler from SEH frames linked list
push 0x40
push paramTitleRedirected
push paramTextRedirected
push 0
call _MessageBoxA@16
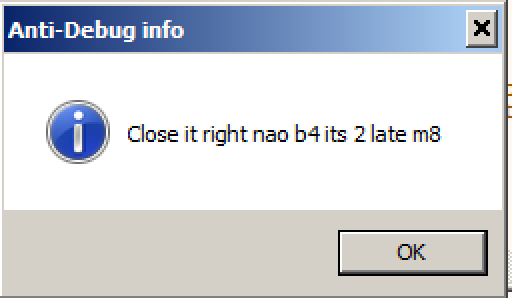
retThis code is not that easy to analyse at first glance. Let me introduce you into some windows internals. SEH is Structured Exception Handling abbreviation. It is native exception handling mechanism used in Windows. I’m sure you saw message like this once.
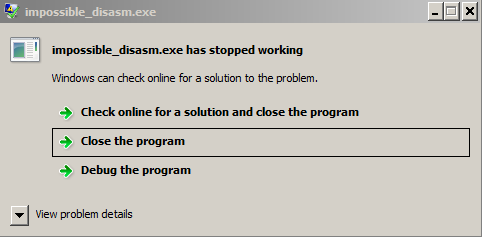
For example your code attempted to divide by 0, program generates exception but there is no user defined handler so the last handler is taken which is responsible for show message about unhandled exception as shown above. SEH allows us to catch this division by 0 and inform program “hey you are doing it wrong, I’m printing message that user supplied wrong numbers and let the program run”. SEH frames are stored in linked list with last added element located at FS:0 (for 32 bit code). SEH frame consist of pointer to next frame and handler, we can represent it like that.
SEH_frame * next
func_pointer exception_handler
Steps to set new SEH exception handler.
- Get current SEH frame address.
- Save this address to SEH_frame * next of new frame.
- Save exception handler to new frame.
- Register new SEH frame.
In code above SEH frame is built in first three lines. First line set exception function, second actualize pointer to next frame, third save new SEH frame address as first in linked list (dispatched first). When this is set up, code raise division by 0 exception, our exception handler get called.
Third argument (+0xc on stack) is pointer to CONTEXT structure for current thread (32 bit version).
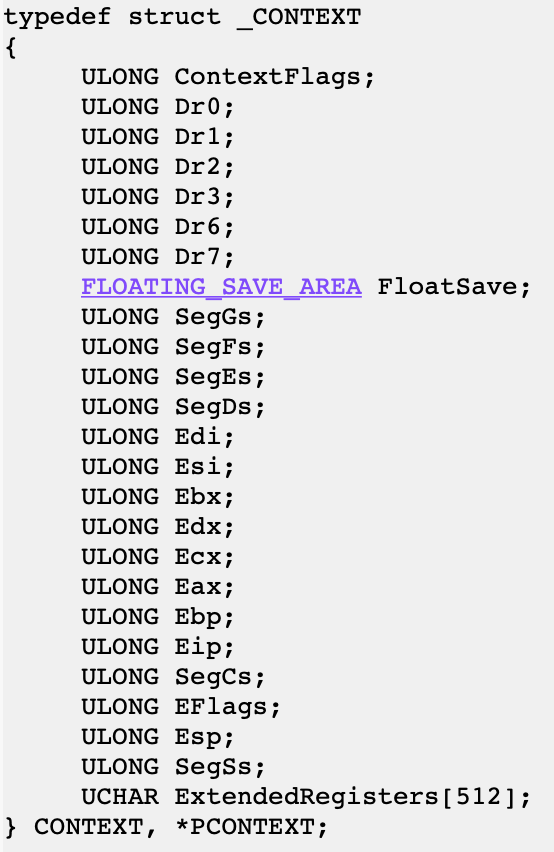
If we change EIP value in this structure we will redirect execution. After handled exception processor context is taken back to its state before exception occured.
exception_handler:
mov ecx, [esp + 0x0c] ; CONTEXT struct, second argument to function
lea edx, [ecx + 0xb8] ; CONTEXT->EIP,
mov dword [edx], redirected_execution ; save redirected function address to CONTEXT->EIP
ret ;
First we are getting second argument for this function which is CONTEXT, dereference it and overwrite EIP. Execution flows to redirected_execution. Now stack points to our lastly created SEH frame. Take it to the state before registering new SEH frame and we are clean to return.
Whole example show us that we can in some way hide calling a function. During static analysis of such program IDA might suppose that redirected_execution is never called, maybe it’s some kind of data.
Above we can see redirected_execution block of code interpreted by IDA, totally misleading. Good job, we surprised disassembler.
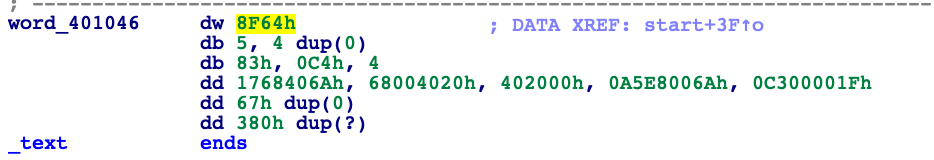
fake ret instruction
call $+5 ; this instruction is 5 bytes long
add dword [esp], 5 ;
ret ; ret and add dword [esp], 5 added together are 5 bytes long
push ebp ; we end up there
mov ebp, esp
mov eax, 0xbeefc0de
pop ebp
ret
call $+5 saves onto the stack adress of next instruction (add dword [esp], 5). add dword [esp], 5 adds to this addres 5 which is summary of this instruction itself plus ret. This leads us to situation when ret returns to push ebp (4th line), so it behaves like nop instruction. Disassemblers assume that function ends with ret instruction and this example can confuse IDA. Let us see.
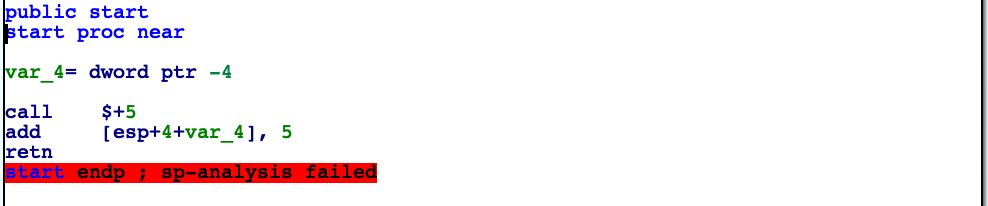
IDA decided not to disassemble after ret instruction.
complex nop
Let’s take a look at sample code of shared object (inline assembly syntax compatible with MinGW).
#include <stdio.h>
#include <windows.h>
void my_puts (const char* arg)
{
printf("intercepted [%s]\n",arg);
}
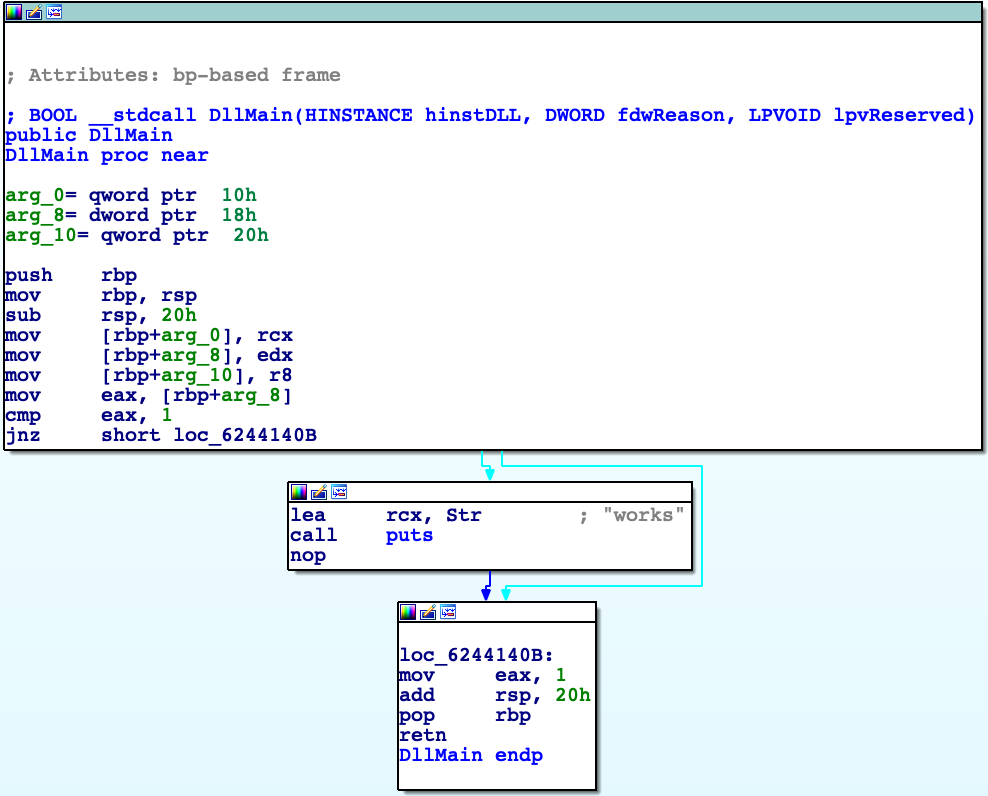
BOOL WINAPI DllMain(HINSTANCE hInstDLL,DWORD fdwReason,LPVOID lpvReserved)
{
switch(fdwReason)
{
case DLL_PROCESS_ATTACH:
{
asm (".byte 0xeb");
asm (".byte 0xff");
asm (".byte 0xc0");
asm (".byte 0x48");
puts("works");
}
break;
}
return TRUE;
}What are these mysterious inline assembly bytes ? Let me explain it by image.
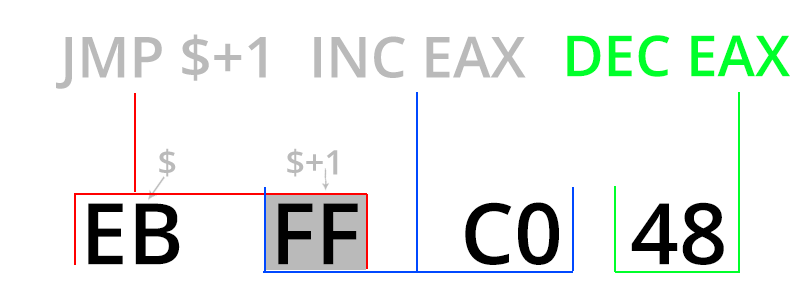
First instruction that processor spots is jmp $ + 1, then this instruction jumps one byte further and it’s inc eax instruction. Next instruction is dec eax so context is not changed by these instructions, we can call it like 4 byte nop. One main difference is fact that this nop mess up disassembly (below case from IDA).
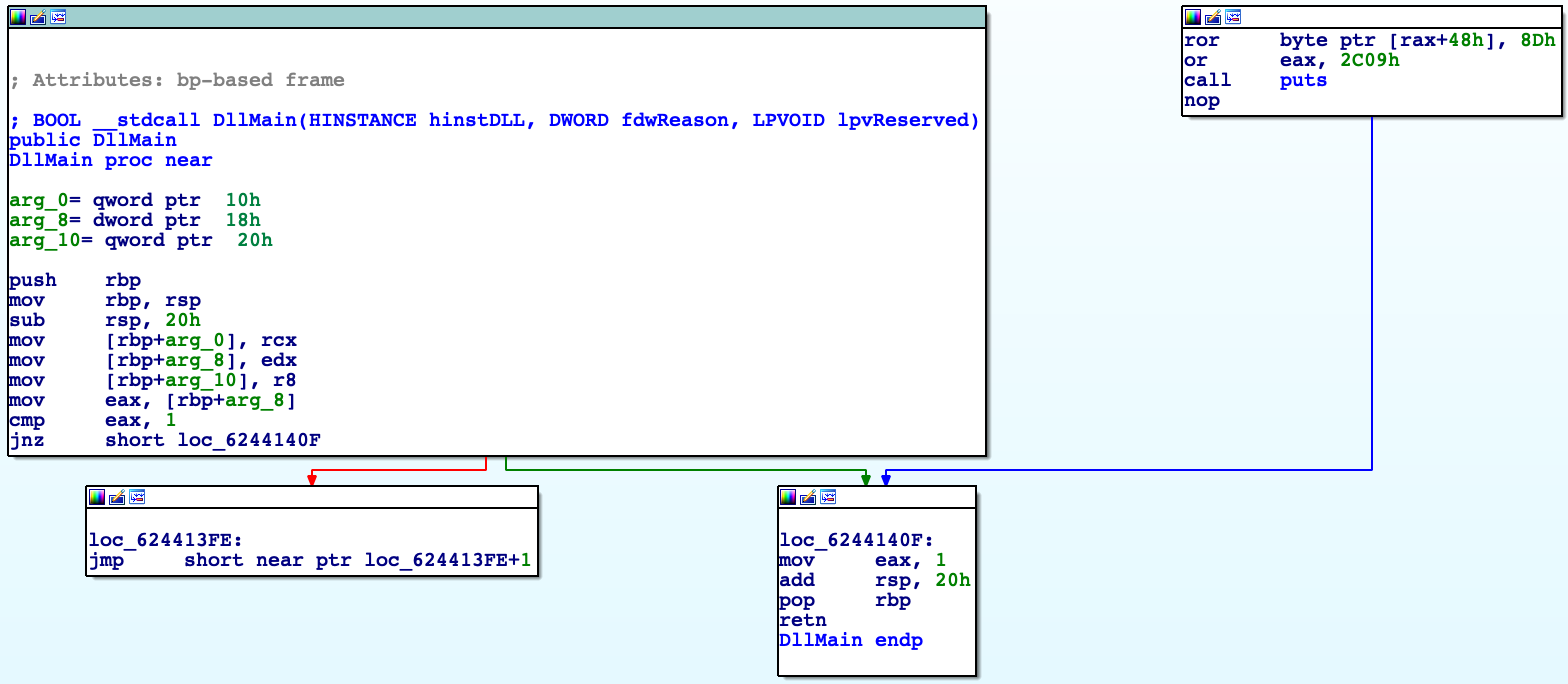
As we can see logic of program is broken, IDA couldn’t examine connection between basic blocks well. For comparison disassembly without complex nop below.
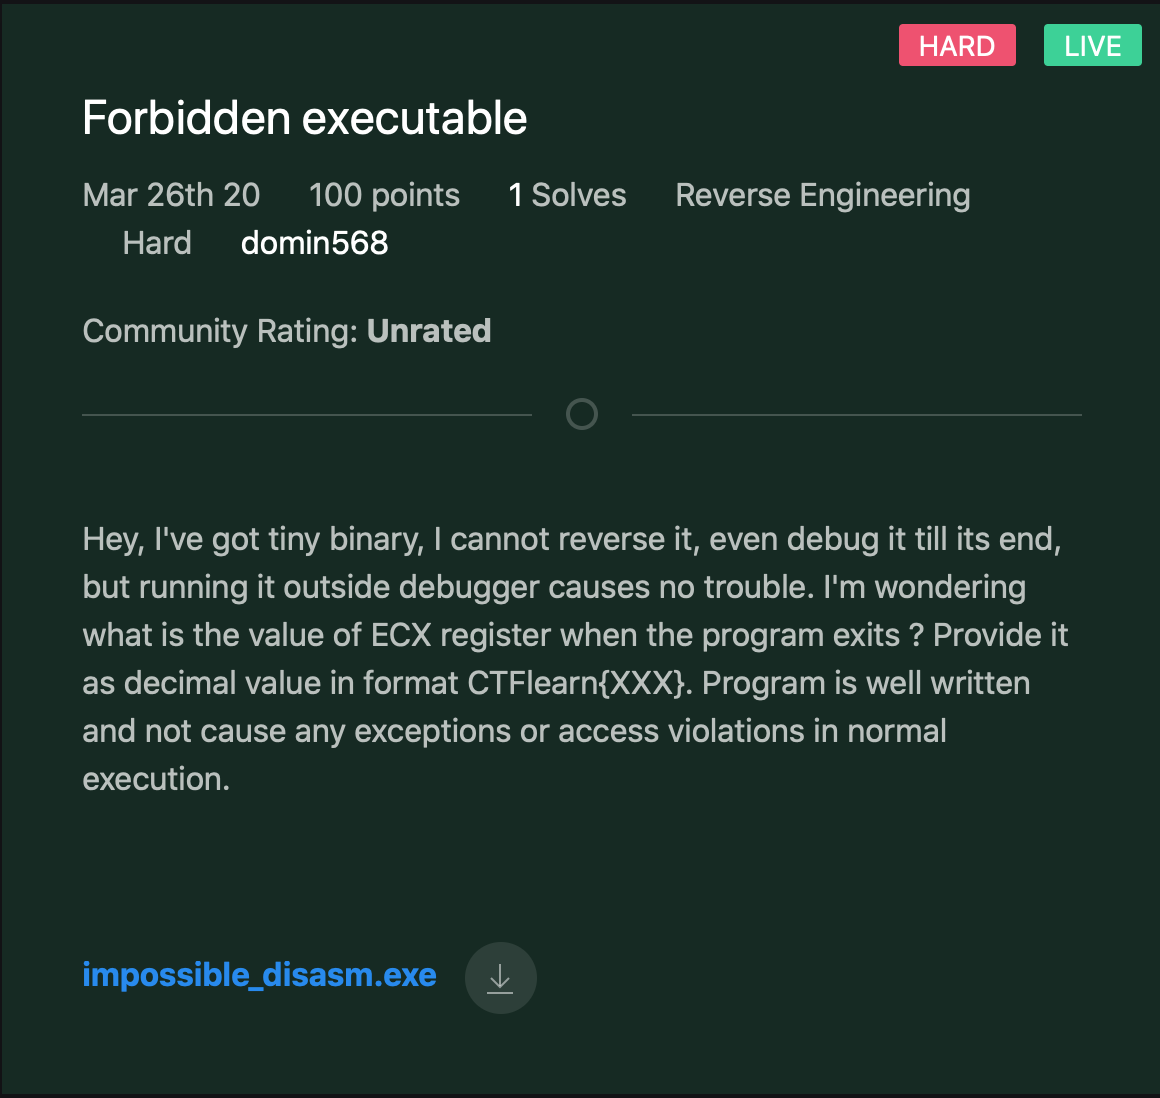
More complex example of using this technique and others you can see at my CTF challenge at CTFlearn (click on it).
Anti debugging techniques on Windows (32 bit subsystem)
I will cover only the most crucial code that is needed to understand example. Code that make up whole executable and shows out pretty MessageBoxes with informations are available on my GitHub
I made it that way in order to not paste here too much redundant code. All names of functions from API are in particular form: _func@(number of arguments * 4) because name mangling for stdcall functions.
isDebuggerPresent ()
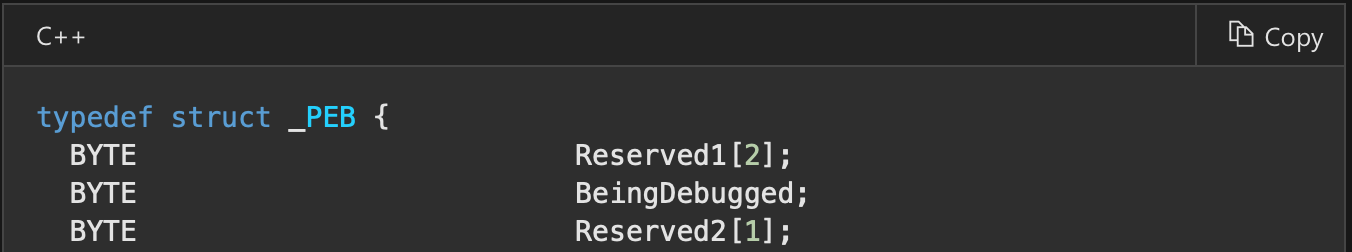
The easiest to bypass and detect is isDebuggerPresent () check. This function internally locate PEB (Process Environment Block) and checks its second variable BeingDebugged. Simple as that.
call _isDebuggerPresent@0
cmp eax, 1
je debugged
If we want to implement such function by ourselves it would be something like that.
mov eax, [fs:0x30] ; pointer to PEB
cmp dword [eax+2], 1
je debugged
; continue normally program
debugged:
ret
At fs:0x30 there is always located pointer to PEB.
checkRemoteDebuggerPresent ()
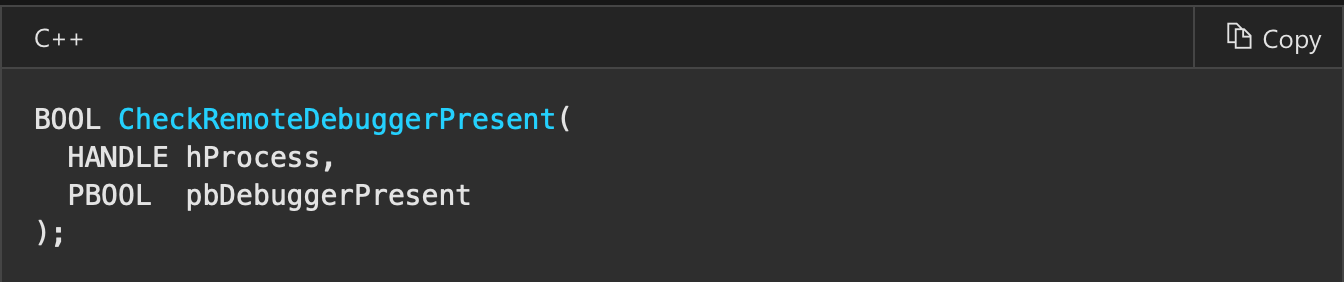
Another simple example of using windows API. In this function we need to supply handle to process which we want to check. We can obtain it by GetCurrentProc or pass -1 (which is pseudohandle for current process).
call _GetCurrentProcess@0
sub esp, 4 ; variable on stack that gets return value
push esp
push eax ; or just pass 0xffffffff instead
call _CheckRemoteDebuggerPresent@8
mov ecx, [esp]
add esp, 4
cmp ecx, 1
je debugged
This function internally calls NtQueryInformationProcess to get debug port, nonzero value inditcates debugger which is going to be explained later.
checking for int3 instructions (are there any software breakpoints set in debugger ?)
When we set a breakpoint in our code what does debugger do is placing int3 (0xcc value instruction set) at address of our choice (removing original byte and restoring it after execution). int3 generates exception and debugger intercept it. Scaning code memory for 0xcc can result in debugger detection.
call $+5
pop edi ; get adress of this instruction
add edi, 15 ; avoid 0xcc which is in mov eax, 0xcc instruction
mov ecx, 0x400 ; how many bytes compared
mov eax, 0xcc ; what we are comparing to
repne scasb ; compare further 0x400 bytes until found or ecx == 0
je debugged
NtGlobalFlags checking
Let’s check PEB structure again.
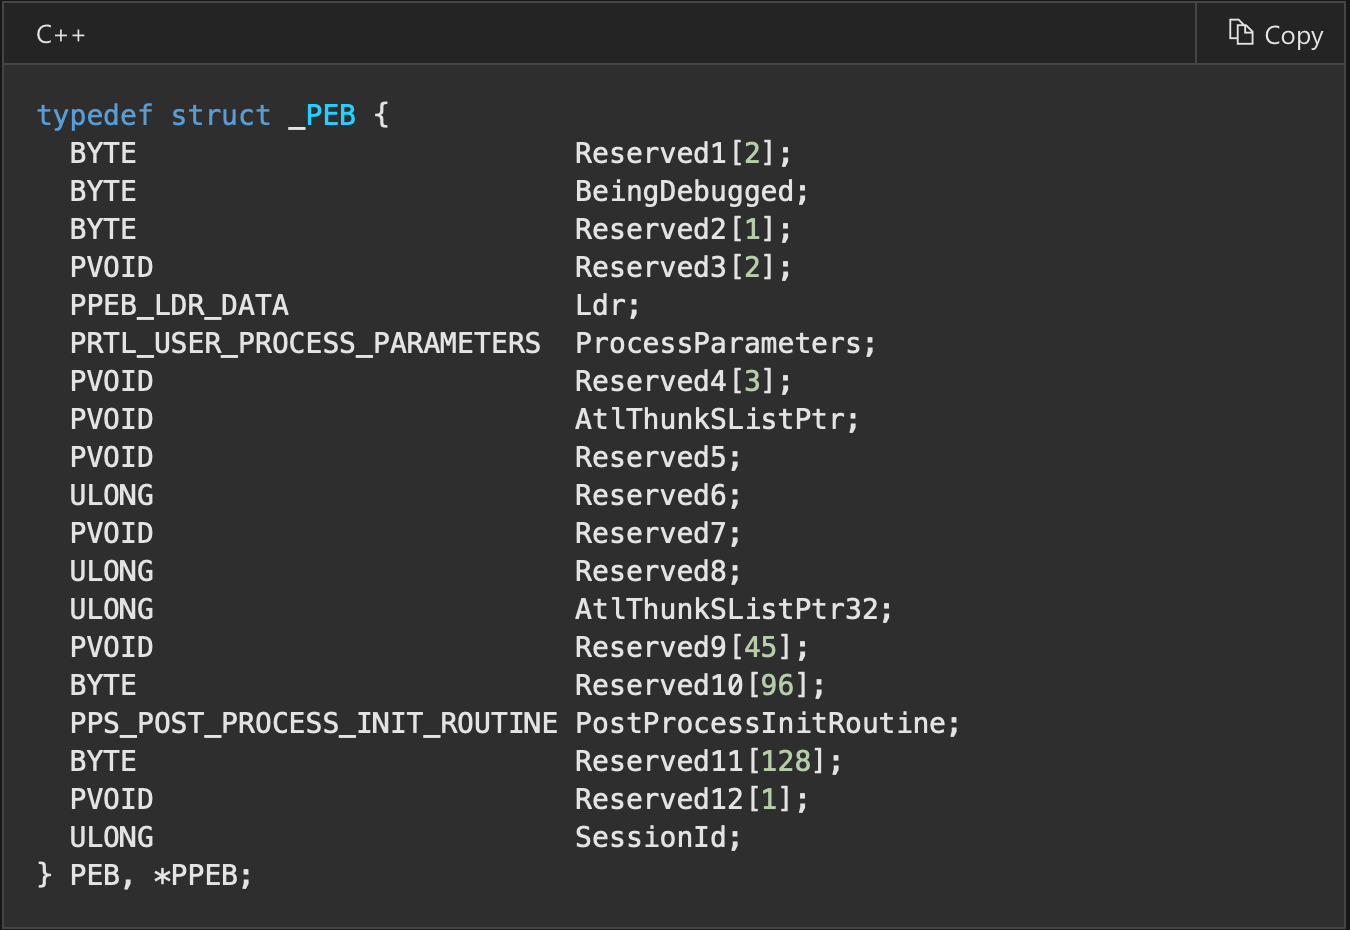
A lot of members are reserved and not documented. Hapilly it has been documented by third parties. At offset 0x68 we have NtGlobalFlags. So do not be discouraged when you see “Reserved” in documentation. Usually when process is handled by debugger these flags are set.
FLG_HEAP_ENABLE_TAIL_CHECK (0x10)
FLG_HEAP_ENABLE_FREE_CHECK (0x20)
FLG_HEAP_VALIDATE_PARAMETERS (0x40)
Combination of these gives us 0x70. These flags can enable specific advanced debugging, diagnostic, and troubleshooting features. In this example connected with heap. As we can see by default when debugger is connected to process it has additional features enabled. If process is ran normally NtGlobalFlags should be equal to 0.
mov eax, [fs:0x30]
cmp dword [eax+0x68], 0x70
je debugged
OpenProcess csrss.exe
By this technique we do not have feedback whether someone is debugging our application explicit. Some debuggers (like OllyDbg) when ran by administrator set to debugged process specific permission “SeDebugPrivilege” (but x64dbg by default not). To check presence of this permission we can try to open critical Windows process csrss.exe because only users that are members of the administrators group with debug privilege can open this process. Csrss.exe is always running and we can get its pid by CsrGetProcessId function. If our program normally does not need this privilege to run then someone is doing something nasty with it.
call _CsrGetProcessId@0 ; get pid of csrss.exe in system
push eax
push 0
push 0x1f0fff ;  ALL_ACCESS
call _OpenProcess@12
test eax, eax
jne admin_with_debug_priv
Hide thread from debugger with NtSetInformationThread
Efficient technique to prevent debugging may be hide thread from debugger. When we set breakpoint somewhere in code and in the meantime debugger is detached from process then program will crash with unhandled exception. The reason for that is int3 instruction inserted by debugger in our code. Now when thread is hided and do not send notifications to debugger there is no handler to catch breakpoint exception. By setting HideThreadFromDebugger debugger is not going to get any notifications making it useless.
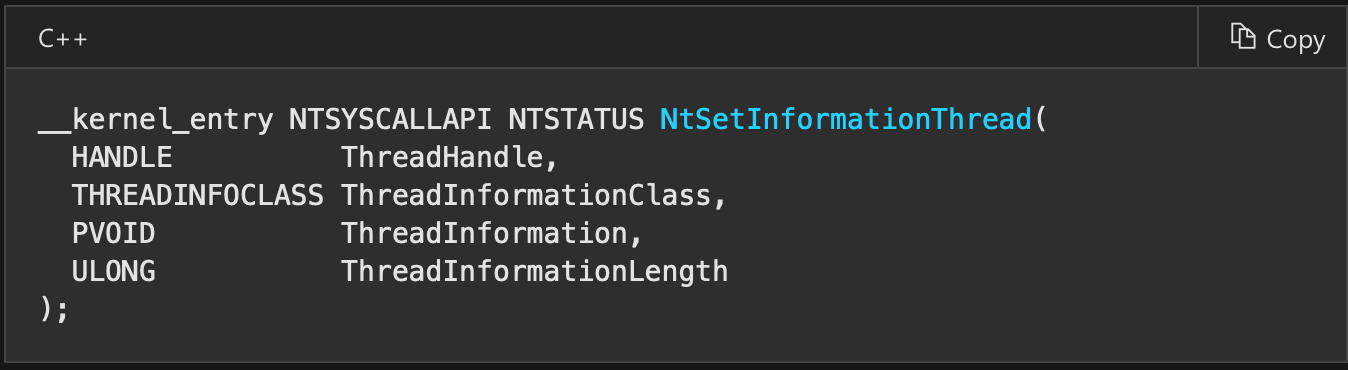
As second arguement we set constant ThreadHideFromDebugger, third and fourth can be null, we do not need to provide any additional info. -2 is pseudohandle for current thread. After this operation debugger program can become unresponsive.

call _GetCurrentThread@0

push 0
push 0
push 0x11 ; hide from debugger
push eax ; 0xfffffffe is current thread
call _NtSetInformationThread@16
check debug port using NtQueryInformationProcess
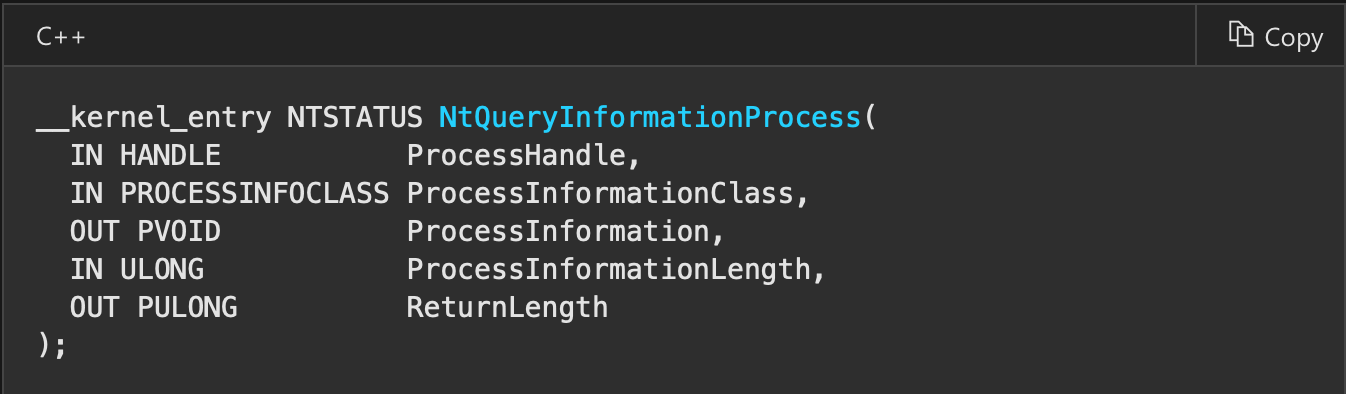
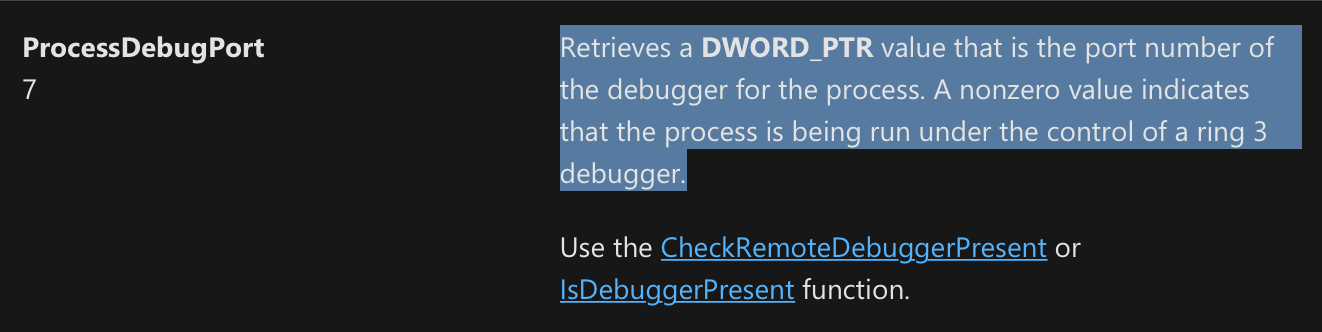
Following code is used internally in function checkRemoteDebuggerPresent mentioned before. Function is used to retrieve various information about process like name suggests. We want to retrieve debug port for current process. We have to supply memory location for number of debug port to be returned. We can allocate it on stack like in this example. When the process is being debugged, the return value is 0xffffffff (-1).
call _GetCurrentProcess@0
mov ecx, eax

sub esp, 4 ; allocating memory on stack for return value
mov edx, esp
push 0
push 4
push edx
push 7 ; ProcessDebugPorts
push ecx
call _NtQueryInformationProcess@20
mov ecx, [esp]
add esp, 4
cmp ecx, 0
jne debugged
checks heap flags
First we are obtaining PEB adress, then at offset 0x18 within it there is first heap area for process. It has header with fields (ForceFlags and Flags) that are used by kernel to get to know whether process was created within a debugger. These fields offsets are 0x40 and 0x44 accordingly (quickly checking for Windows 10 also). In Windows 7 64 bit build 7601 it is as in following image.
When not started by debugger it should be equal to 0.
mov eax, [fs:0x30]
mov eax, [eax+0x18]
cmp dword [eax+0x44], 0 ; offset for windows 7 x86-32
jne debugged
checking for presence of hardware breakpoints using SEH
We are registering new exception handler, then raise an exception. As mentioned here. SEH handler gets CONTEXT struct. Dr0 to Dr7 are debug resgitsers. First four of these contain adress of hardware breakpoint (meaning we can set only 4 hardware breakpoints). This code checks for hardware breakpoints using SEH exception.
push exception_handler
push dword [fs:0]
mov [fs:0], esp ; register SEH exception handler

xor eax, eax
div eax ; exception
pop dword [fs:0]
add esp, 4
ret

exception_handler:
mov ecx, [esp + 0x0c] ; CONTEXT struct

lea esi, [ecx + 4]
mov ecx, [esi]
cmp ecx, 0
jnz debugged
add esi, 4
mov ecx, [esi]
cmp ecx, 0
jnz debugged
add esi, 4
mov ecx, [esi]
cmp ecx, 0
jnz debugged
add esi, 4
mov ecx, [esi]
cmp ecx, 0
jnz debugged
checking for presence of hardware breakpoints using VEH
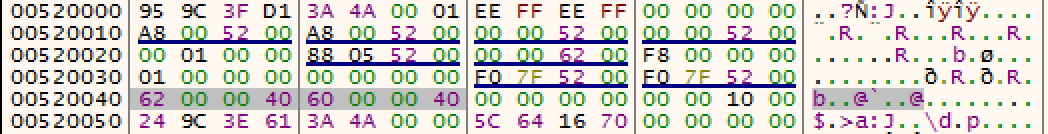
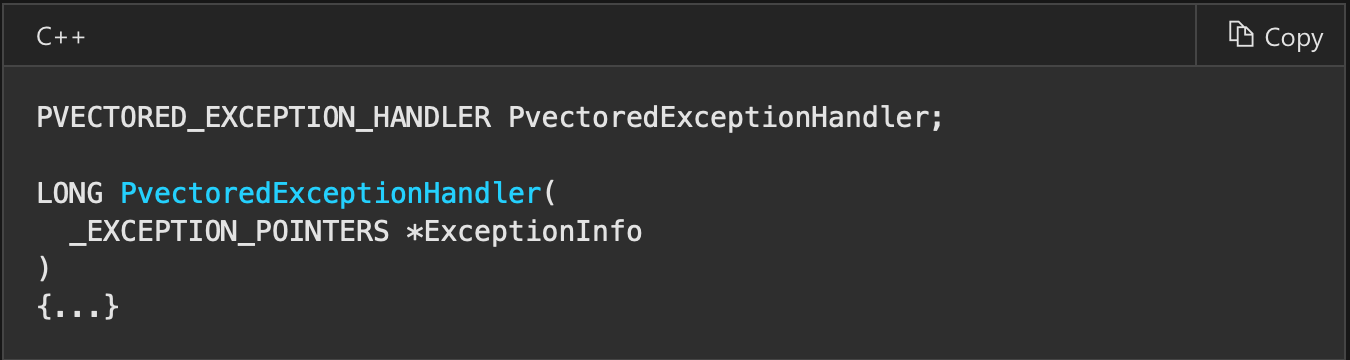
Like in previous example we are going to check hardware breakpoint. In this example we are going to raise exception but by using VEH (Vectored Exception Handling). VEH is used simultaneously with SEH but dispatched always before SEH. To add such exception handler we have to do it through API with AddVectoredExceptionHandler. Simple as that. Declaration of exception handler is as shown below. This technique can also be reproduced at 64 bit Windows due to usage of VEH at these systems (offsets to particular fields are different). SEH at 64 bit systems is not present.
The only argument is pointer to the structure below.
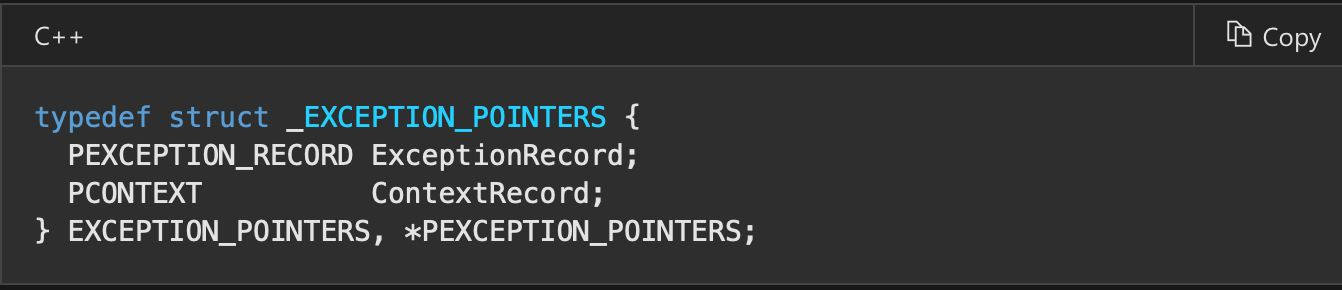
Then we get CONTEXT and check debug registers as before and tell the OS to continue execution.
push exception_handler
push 0
call _AddVectoredExceptionHandler@8
xor eax, eax
div eax
jmp not_debugged

exception_handler:

mov ecx, [esp + 4] ; get pointer to exception_pointers
mov ecx, [ecx + 4] ; get ContextRecord from it
cmp dword [ecx+4], 0
jne debugged
cmp dword [ecx+8], 0
jne debugged
cmp dword [ecx + 12], 0
jne debugged
cmp dword [ecx + 16], 0
jne debugged
add dword [ecx+0xb8], 2 ; pass through exception instruction
mov eax, 0xffffffff ; EXCEPTION_CONTINUE_EXECUTION, meaning exception was well handled, execution goes on.
ret
CloseHandle that raise exception only when debugging
CloseHandle when supplied with wrong handle raises EXCEPTION_INVALID_HANDLE (0xC0000008) exception, but only when process is debugged. We can use this information to check whether debugged is present. First argument to exception handler is pointer to exception type.
push interrupt_handler
mov eax, [fs:0]
push eax
mov [fs:0], esp ; register new SEH exception handler

push 0xbaad
call _CloseHandle@4 ; try to close nonexistent handle
add esp, 8
jmp not_debugged

interrupt_handler: ; if debugger is present then
mov ecx, [esp+4]
mov ecx ,[ecx] ; get exception type
mov esp, [esp+8] ; cleaning
mov edx, [fs:0]
mov edx, [edx]
mov edx, [edx]
mov [fs:0], edx
add esp, 8
cmp ecx, 0xc0000008 ; invalid handle
je debugged
check whether debug message exception is handled
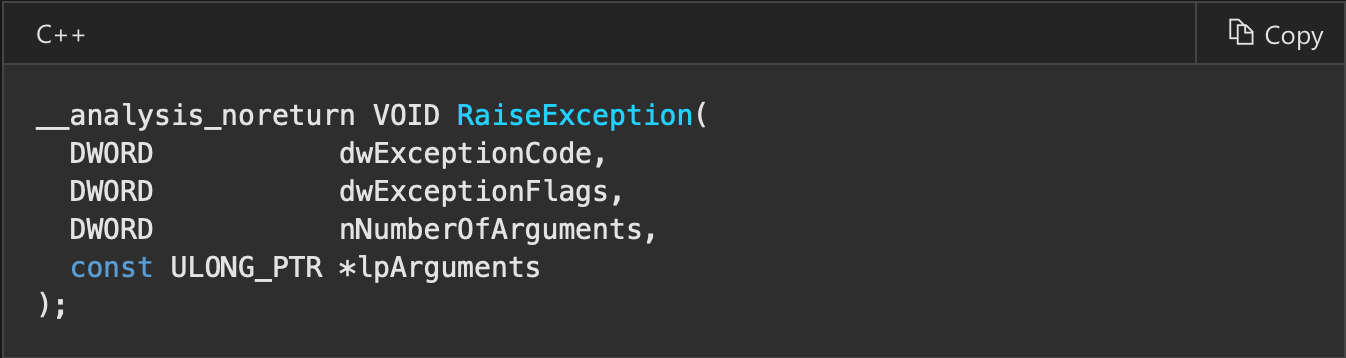
This technique does not work in x64dbg. We raise DBG_PRINT_EXCEPTION_C (ascii version) exception to send message to debugger. If it is handled then we assume that probably by debugger.
mov ecx, [fs:0]
push not_debugged_exception
push ecx
mov [fs:0], esp
sub esp, 4
mov dword [esp], 0x00414141 ; AAA string
sub esp, 16 ; allocate memory for arguments to exception
mov dword [esp], 0
mov dword [esp+4], 0
mov dword [esp+8], 4 ; ascii version arguments as 2nd and 3rd
mov dword [esp+12], ecx
push esp
push 4
push 0
push 0x40010006 ; DBG_PRINT_EXCEPTION_C
call _RaiseException@16
add esp, 28
jmp debugged
not_debugged_exception:
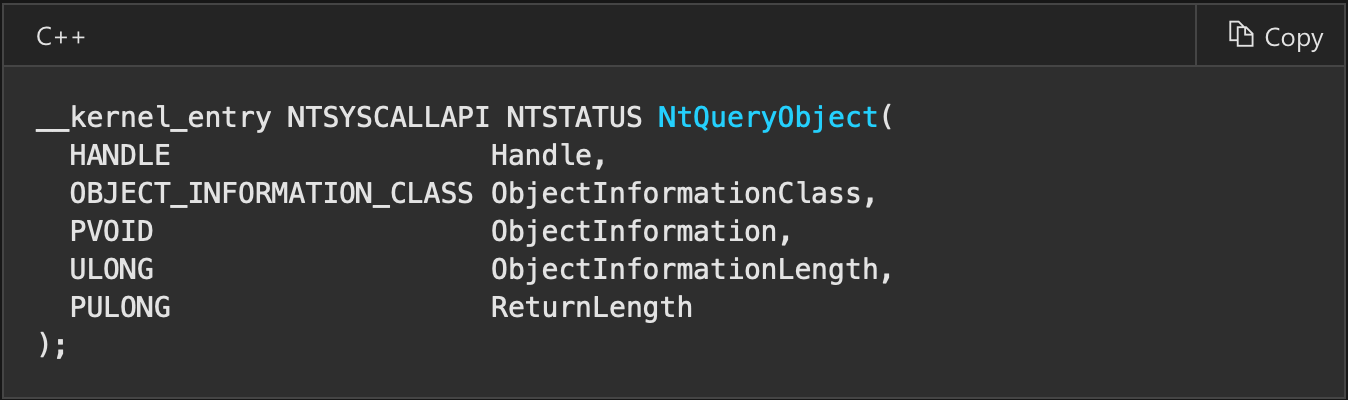
; clean up SEH and continue executionCheck number of debug objects present with NtQueryObject
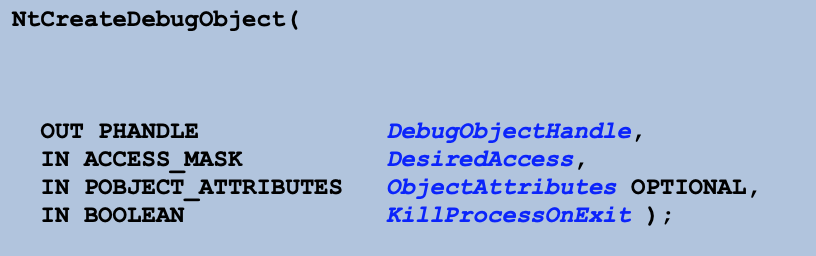
We can use NtQueryObject to enumerate objects of specific type. We provide as second argument ObjectTypeInformation (value 2). ObjectTypeInformation will only return the information of the supplied handle. Every debugger needs debug object to work, so we can count how many debug objects are in our system. We need to supply valid handle to debug object to get informations about this type of objects so we will create one by NtCreateDebugObject. This protection checks whether any binary is debugged, not this particular one, so if we debug other binary and in the same time execute binary normally with this protection then we will get information about process being debugged.
section .data

memory times 0x1000 db 0

section .text

sub esp, 4 ; handle to debug object
mov ecx, esp
sub esp, 24 ; OBJECT_ATTRIBUTES
mov dword [esp], 24
mov dword [esp+4], 0
mov dword [esp+8], 0
mov dword [esp+12], 0
mov dword [esp+16], 0
mov dword [esp+20], 0
mov edx, esp

push 0
push edx
push 0x1f000f ; DEBUG_ALL_ACCESS
push ecx
call _NtCreateDebugObject@16
;add esp, 24
mov ecx, [esp+24] ; get handle to debug object
cmp eax, 0
jb error

push 0
push 0x1000
push memory
push 2 ; ObjectTypeInformation
push ecx ; Handle
call _NtQueryObject@20
mov eax, [memory+8]
add esp, 28
cmp eax, 1
jne debugging
Summary
That’s all for now. If I find new techniques I will update this blogpost. If you have any problems with code provided here send me quick email to domin568@gmail.com. I checked all examples from here on Windows 10 build 17763 and it behaves excatly the same like on Windows 7 build 7601.
Dominik Tamiołło